I’ve always been the ‘picture paints a 1000 words’ type. So when I transitioned from design to a career in research, I found it extremely difficult to analyse data and come up with solutions from an excel spreadsheet.
I’m used to listing problems and sketching up solutions on big pieces of paper. My mind (i.e. a designer’s mind) works best when I can see things from a high level. From there I can inject some creativity, and come up with out-of-the-box ideas to overcome particular hurdles.
Lucky for me – and all you other visual thinkers – there are some great tools at our disposal to help facilitate this type of thinking in the UX world.
Affinity diagramming
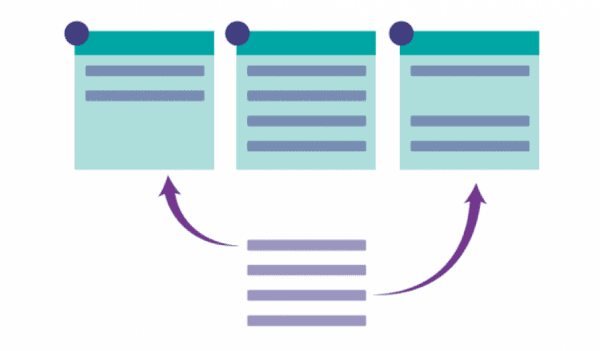
Affinity diagramming is the process of grouping related items together to reveal pain points, discover new product offerings and find out what users are looking for.
This can be done via a workshop with users or your team, and/or your client. (Bringing your client gives them the opportunity to be part of the process.)
One project that I worked on recently was to prove/disprove approximately a dozen hypotheses. We learned a lot about behavior, critical purchase times and user perception. However, organising the information we collected became cumbersome and very difficult to analyse inside a computer.
So instead of slaving away for hours at our desks with no guarantee of making headway, we created an affinity map using butcher’s paper – marking up all the hypotheses we were testing on the wall.
We then printed and manually cut out every comment from our testing session, before matching them with the corresponding hypotheses. Cutting and pasting each individual comment refreshed my memory as to what was said – and this seemingly mundane task freed my mind up, enabling me to start seeing things from a bird’s eye view.
At this point, were able to identify patterns in what people were thinking, and devise with a clear approach for our client regarding the best ways to offer their services. We even identified a new product offering.
Affinity diagramming is extremely helpful when you want to gain an overall picture of research very quickly. At U1, we believe interpreting data effectively is really important – and visual methods of displaying information such as these can help ensure nothing important gets overlooked.